Introduction
This posting walks you through the process of creating an out-of-the-box, no-code drill-down chart in SharePoint 2010. It uses the Northwind sample database transformed to SharePoint 2010 for data, specifically the Products and Categories lists. The Categories list is related to the Products list through a one-to-many relationship. The process involves several discrete steps:
This posting as shown how to create a no-code drill-down chart in SharePoint 2010. It has also shown a few ways in which to enhance the chart's appearance. For additional details on the topics discussed in this posting, see the references below.
References
Notes
This posting walks you through the process of creating an out-of-the-box, no-code drill-down chart in SharePoint 2010. It uses the Northwind sample database transformed to SharePoint 2010 for data, specifically the Products and Categories lists. The Categories list is related to the Products list through a one-to-many relationship. The process involves several discrete steps:
- Inserting the Chart web part onto the target page.
- Adding a count field to the Categories list that automatically counts the number of occurrences of a Category item in the Products list.
- Connecting the Chart web part to the Categories list.
- Configuring Chart drill-down capability.
- Launch SharePoint Designer 2010, and then connect to the target site.
- In Designer insert the Chart web part onto the target page.
- Next, in Code view, search for the ShowToolbar parameter, and then set this to False. You will not need to go to Advanced Mode to make this change.
- Select the Chart web part inserted on the page, and then, on the Format ribbon, click Chrome Type, and then click None.
- Click the Chrome State button, and then click Normal.
- Save the file and then exit Designer.
- You should see something like the following:


- Launch a browser, and then connect to the target site.
- Navigate to the Categories list:

- Select the List ribbon.
- In the Manage Views group, click the Add Column button (to find it, hover the cursor over ribbon items to view a popup title of the item). The Create Column modal dialog appears.
- Configure as follows:
- Column name: Count.
- Type of information: Lookup.
- Get information from: Products.
- In this column: Category (Count Related).
- Leave all other fields default:

- Click OK. The Categories list now displays the number of times that each category was used in the Products table:


- Launch a browser and then connect to the target page.
- On the Page ribbon, click Edit Page.
- As you move the cursor over the chart web part, a dropdown will appear across from the web part title. Click the dropdown, and then point to Connect to Data:

- Click this menu item.
- Select Connect to a List.
- Click Next.
- Select the site where the Products list is hosted; select the Categories list.
- Click Next.
- Click Next.
- Expand the Series Properties area, and then configure as follows:
- Series Name: CategoryCounts.
- Series Type: Bar.
- Leave all other fields default:

- Click Finish.


- NOTE: after making each change below, press ENTER. Changes can be made only one at a time, as each change triggers a page reload.
- Launch a browser and then connect to the target page.
- On the Page ribbon, click Edit Page.
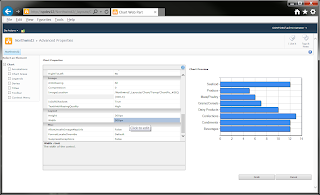
- As you move the cursor over the chart web part, a dropdown will appear across from the web part title. Click the dropdown, and then point to Advanced Properties.:

- In the Select and Element tree at left, click Series.
- On the Chart Properties listing, scroll down to the MapArea group.
- Enter the following URL+keyword string:
/Northwind2/Lists/Products/AllItems.aspx?FilterField1=Category&FilterValue1=#VALX

- Click Finish.
- Move the cursor over the bars to see the unique URL now configured for each:Clicking on any bar navigates the browser to the Products list, now filtered by the appropriate category value. For example, clicking the Seafood bar in the chart, which has a value of 12, navigates the browser to the Products list, which lists 12 seafood items:


- Launch a browser and then connect to the target page.
- On the Page ribbon, click Edit Page.
- As you move the cursor over the chart web part, a dropdown will appear across from the web part title. Click the dropdown, and then point to Advanced Properties.
- Change Chart Dimensions
- In the Chart Properties listing, scroll down to the Layout group, and change Width to 500px.
- Press Enter. The change is then implemented:Be sure to press Enter after making each change. Otherwise, you might lose some changes.
- Show Interlaced
- On the Select an Element tree, select Chart Areas.
- From the Axis Menu, select X axis.
- In the Chart Properties listing, in the Appearance group, configure as follows (press Enter each time):
- IsInterlaced: True.
- InterlacedColor: WhiteSmoke.
- The changes will be implemented immediately:

- Click Finish.
- Add Title
- On the Select an Element tree, select Titles.
- Click the small + sign just above the top right corner of the Chart Properties list. This adds a new Title object to the chart, and the Chart Properties listing now displays configurable parameters for this object.
- In the Appearance group, scrolling down a bit, look for the Text parameter and then set the text to the desired title.
- Scroll just a bit back up, looking for the Size and Bold parameters, setting these to 12 and True respectively:
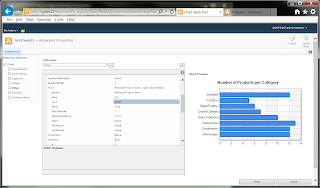
- Add Axis Labels
- On the Select an Element tree, select Chart Areas.
- From the Axis Menu, select X axis.
- Scroll down to the Title group.
- Set the Bold parameter to True.
- Enter the desired x-axis title into the Title parameter.
- From the Axis Menu, select Y axis.
- Scroll down to the Title group.
- Set the Bold parameter to True.
- Enter the desired y-axis title into the Title parameter.
- Now the chart has X and Y axis labels:

- Click Finish.
- Display each bar in different color
- On the Select an Element tree, select Series.
- On the Series Menu, select the desired series (if you have only one series, this will likely display as Default).
- On the Chart Properties listing, in the Appearance group, scroll down until you see the Palette property. By default, this will be set to None.
- Select any other setting available from this dropdown. The change will be immediate:

- Click Finish.
- Hide the Data & Appearance and Advanced Properties toolbar
- For this you will need SharePoint Designer and Design permissions to the site or page.
- Launch SharePoint Designer 2010.
- Connect to the site hosting the page containing the chart web part.
- Checkout the file
- Detach the file from the layout.
- Open the page in Advanced edit view.
- Search for ShowToolbar.
- Set this parameter to False.
- Save the file.
- Check it back in.
- The final interactive chart:


This posting as shown how to create a no-code drill-down chart in SharePoint 2010. It has also shown a few ways in which to enhance the chart's appearance. For additional details on the topics discussed in this posting, see the references below.
References
Notes
- The URL defined in Step 4.7 does not include the view ID. You see this ID when you choose to filter a list by some column value in the list. You don't need this ID if you are referring to just one list, and this list is located on a different page, such as an application page. However, if you are building page containing lists, and the charts are referring to those lists, you will need to use the view ID. Otherwise you will experience this error: One or more field types are not installed properly. Go to the list settings page to delete these fields.
- The method presented here also works for the chart web part in SharePoint 2013.
No comments:
Post a Comment